Mobility and logistics in Brussels commercial nodes
- Categories
-
Retail & Horeca
In its 2018 diagnosis, the Brussels-Capital Region’s Commercial Development Scheme identified the themes on which action should be taken to improve the framework in which the commercial function evolves. One of the actions identified was to draw up a mobility and logistics profile of the commercial centres. This is now complete, so go ahead and discover the trends!
Despite the existence of a great deal of data on commerce and mobility, there are very few detailed cross-case analyses in Brussels. hub.brussels therefore decided, in partnership with the ULB, to create a series of indicators across the Region’s 123 commercial centres, based mainly on data available in open data.
What’s the goal? To create new statistical series that can be updated over the years, but also and above all appreciate the diversity of local situations. Here are some of the lessons learned…
Commerce and mobility: an equation with three variables
Commerce and mobility are intrinsically linked. For customers, the trips they make as a result of their purchasing behaviour represent the second most important reason for travel, after commuting.
From the retailers’ point of view, good accessibility is often a key factor in how attractive their business is. As for public players, they need to adapt mobility to today’s environmental challenges, while maintaining an attractive and economically healthy urban commercial fabric.
Putting walking and cycling before the car
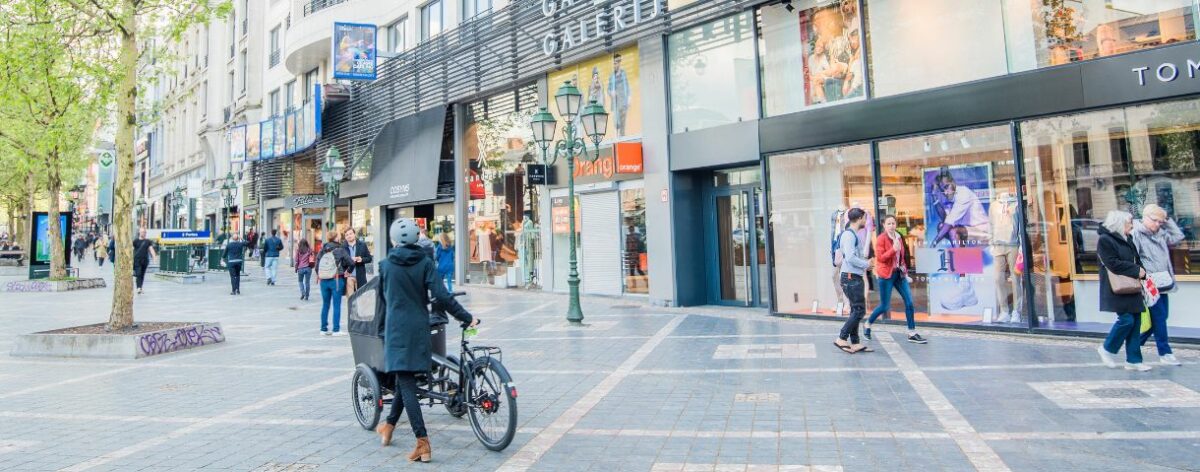
In Brussels, the car is not the only mode of transport used for shopping. Its use depends on a number of factors and therefore varies between different commercial centres: the profile of shoppers, the attractiveness of shopping areas, types of shops, etc.
However, hub.brussels’ shopper surveys show that walking and cycling account for 48% of the means of transport reported by shoppers visiting the stores surveyed.
Of course, this can be qualified by the commercial centre:
- Centres with a greater reach (Rue Neuve, Porte de Namur, Rue de Brabant, etc.) where there is a balance between people who say they come by car and those who come by public transport;
- Centres with a municipal or regional influence (Saint-Guidon in Anderlecht, Molenbeek Centre, etc.) where walking, cycling and public transport are more common in the inner suburbs, while cars and active modes of transport dominate in the more peripheral centres;
- Small centres where, on a gradient from the centre to the outskirts, we move from a situation where walking and cycling are dominant to one where cars are the most popular.
Difficult parking conditions in the inner suburbs
In the 123 commercial centres studied, there are a total of almost 124,000 parking spaces, most of them on-street (59%). On average, this means there are just over seven customer parking spaces available for each store located in a commercial centre. However, these spaces are also used for many other purposes, such as parking for workers and visitors to the area.
Overall, the commercial centres in the city centre (Rue Neuve, Dansaert, Sablon, etc.) benefit from a significant parking supply, thanks to the car parks located along the inner ring road. Conversely, the major commercial centres in the inner suburbs (such as Saint-Gilles and Molenbeek) only have limited parking facilities, either on or off-street.
Furthermore, while the commercial centres in the city centre have low night-time occupancy (due in part to the low density of inhabitants), the commercial centres in the inner suburbs experience (almost) constant saturation. However, on-street parking is not offset by off-street parking, as is the case in the city centre.
Hundreds of delivery vehicles every week
On a regional scale, it is estimated that retail generates about one third of the road freight journeys in Brussels. On average, the stores studied receive about one delivery a day. However, this frequency varies according to the size of the shop, whether it belongs to a chain store network, and the types of products sold.
The average number of weekly deliveries made is estimated at 118,000 in the 123 commercial centres considered. Of these, 31% would be carried out by heavy goods vehicles. Regardless of the size of the centre, delivery frequency is higher in the smallest centres and those in the inner suburbs (many independent shops selling basic necessities). Conversely, the commercial centres in the outer suburbs as well as the central centres with a strong reach (with numerous non-food chain stores) present a low ratio of deliveries.
More news:

After Audi: Brussels foreign trade in the first half of 2025
Posted on 28/01/2026
